Smart Cost Builder With Google Sheets
Documentation
The Text Field Input allows users to enter text or numeric values directly into your calculator. This input is versatile and can be used for capturing a wide range of user data, from simple numbers to more complex text inputs. Simply drag and drop the text field element into your calculator layout and map it to the appropriate cell in your Google Sheet for processing.
The Slider Input allows users to select a value within a specified range by sliding a handle along a track. Administrators can set and lock the maximum value or keep it unlocked, allowing users to enter values beyond the slider’s limit. The slider also includes a manual input box, giving users the flexibility to either adjust the slider or input a value directly. Simply drag and drop the slider element into your calculator and configure it to meet your needs.
The Table result element allows you to display data from your Google Sheets in a structured, tabular format on your calculator. Simply specify the range of cells from your Google Sheet that you want to display. You can also customize the table by providing a title and tooltip, and choose whether the first row should be used as the table header.
This element is perfect for showcasing detailed reports, comparisons, or any dataset in an easy-to-read format. Just configure the settings, save, and your table will be ready to display on your website.
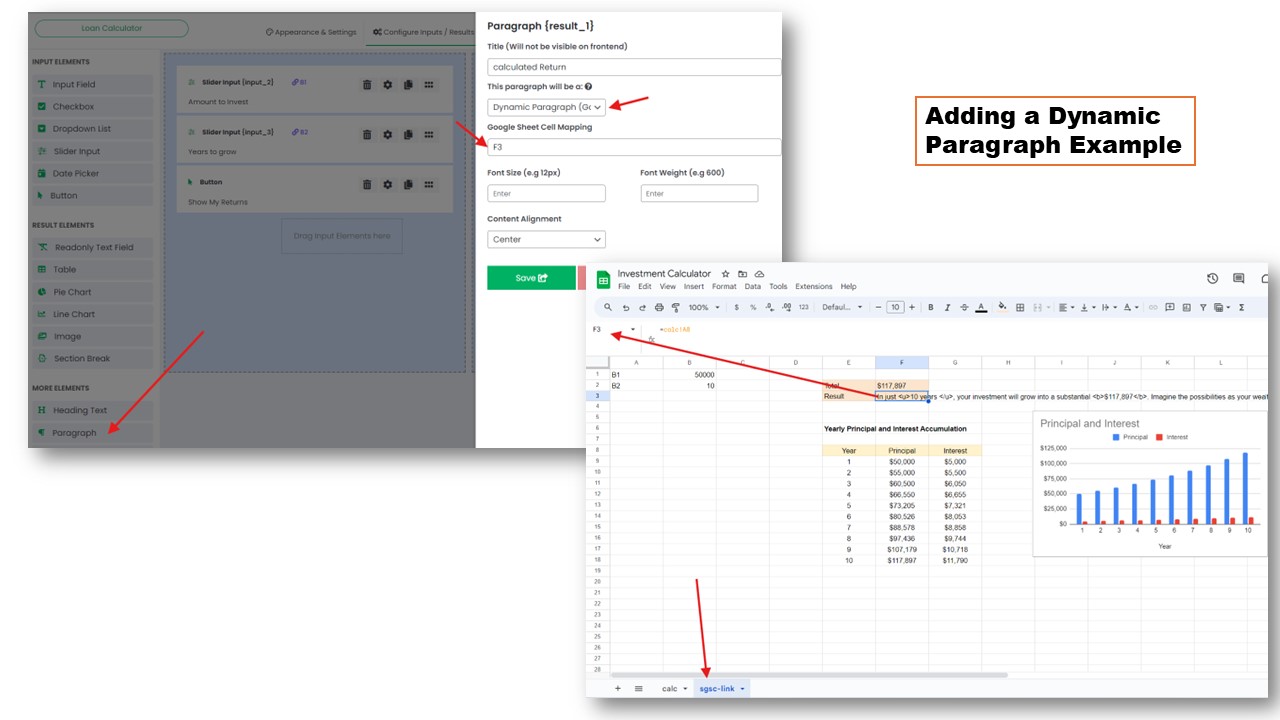
The Paragraph result Element allows you to display text in your calculator, either as a static message or a dynamic one that updates based on data from your Google Sheets.
- Static Paragraph: Use this option to display fixed text that remains the same regardless of user inputs or calculations.
- Dynamic Paragraph: This option links the paragraph to a specific cell in your Google Sheet, allowing the text to change dynamically based on the data or calculations in that cell.
Additionally, users can add HTML styling directly within the Google Sheet cell, which will be reflected in the calculator. Customize the appearance further by adjusting the font size, font weight, and text alignment. This feature is ideal for providing users with styled, context-rich, or dynamically updated messages within your calculator.
The Chart result element enables you to display data visually using either a line chart or a column chart, depending on your needs. Users can select the chart type (line or column) and specify the Google Sheet ranges for series labels, x-axis labels, and y-axis data. You can further customize the chart by naming the axes, choosing colors for the series, and enabling legends.
This feature is ideal for presenting trends, comparisons, and data insights in a clear and visually appealing manner directly within your calculator.
When working with a Line or column Chart using transposed data, you can easily adjust the Google Sheet ranges to match the layout of your data. In this setup, the series labels, x-axis labels, and y-axis data might be arranged differently compared to standard layouts. Ensure that you accurately map the ranges for each axis and series in the plugin settings to generate a precise and visually clear line chart.
This approach is particularly useful when your data is structured horizontally across rows, allowing for flexibility in how the data is visualized.
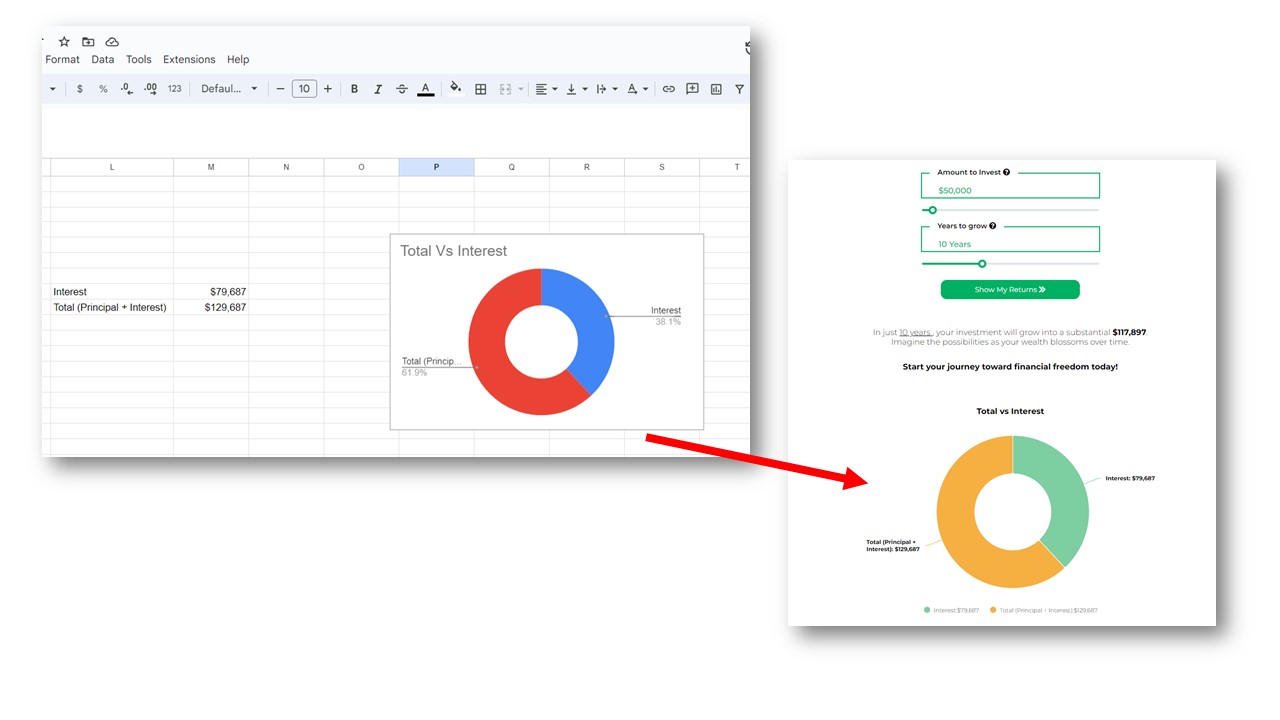
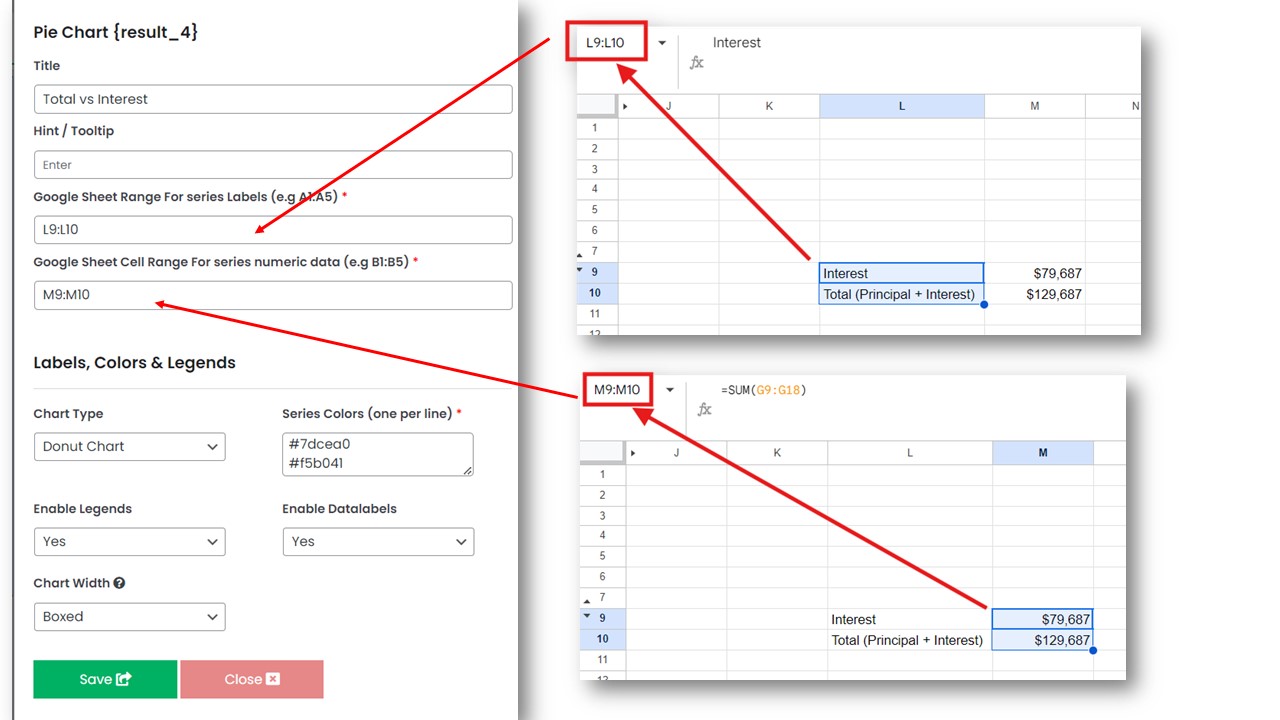
The Pie chart element allows you to visually represent your data using Donut, Pie, and 3D Pie Charts. These chart types are perfect for displaying proportions, percentages, and distributions within a dataset. Simply select the chart type (Donut, Pie, or 3D Pie) in the plugin settings, and specify the Google Sheet ranges for your data.
Customize the appearance by adjusting colors and labels to match your needs, providing your users with an intuitive and engaging visual representation of your data.
Refering to the example above, here is configuration for a donut chart.
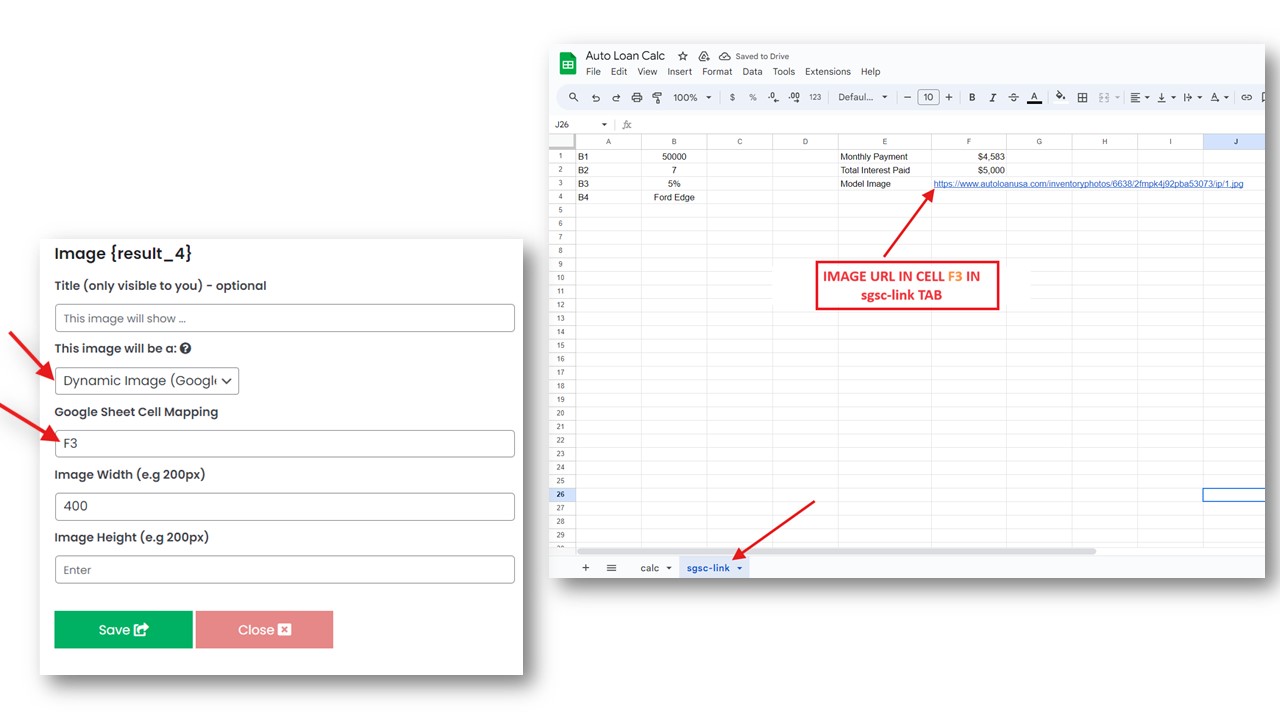
The Image element allows you to display either Dynamic or Static Images within your calculator.
- Static Images: These are fixed images that remain the same regardless of user inputs or calculations. Simply upload the image you want to display.
- Dynamic Images: These images change based on the data or conditions specified in your Google Sheet. By linking an image URL to a specific cell in your Google Sheet, the plugin can dynamically update the image displayed in the calculator based on the latest data.
This feature is ideal for enhancing your calculator with visual elements that respond to user interactions or remain consistent as needed.
Useful Links
©2022.Wp Plugin Box All Rights Reserved.


